Public Health
Management
Public Health Analytics
Breakthrough solution addresses overall public health
needs

The solution provides the analysis of the public health data in order to prevent, detect and respond proactively to any related issues. That will guide healthcare stakeholders to equitable and preventive actions.
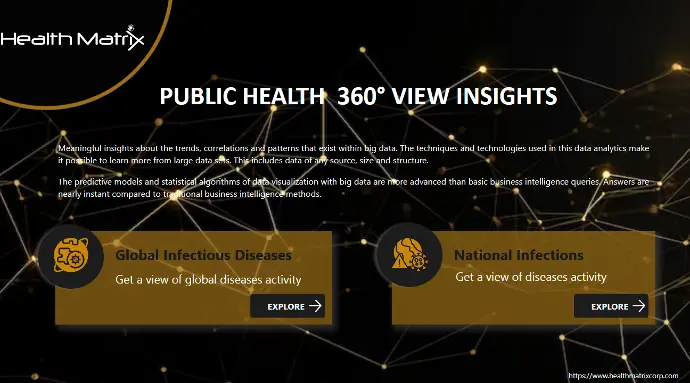
Global and national
The solution provides meaningful insights of the following: Global Infectious Disease
National Level Infections
Global Infectious Disease
National Level Infections
The solution is designed to receive public health data and infections
data from multiple data sources, going through data modeling, artificial intelligence and machine learning in order to ultimately analyze and
visualize the data for better informed decisions in public health domain.

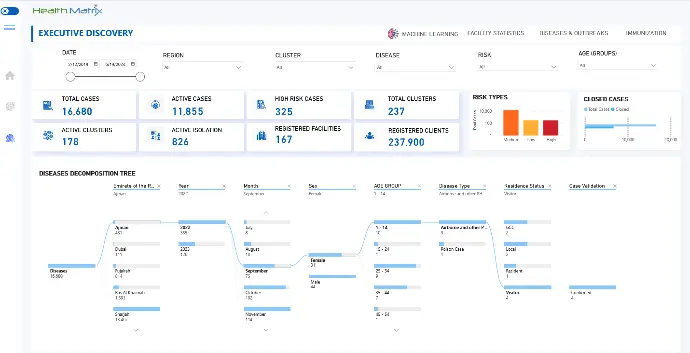
Deep insights
Our advanced Public Health Analytics platform provides 360 degree
visibility on significant KPIs, and enables data driven decisions using
AI algorithms. The public health analytics platform consists of the
following components: Communicable surveillance including Cases and Outbreaks Non communicable Diseases including Chronic diseases New emerged diseases Control measures as immunization or quarantine

Risk assessment

Disease spreading
In addition, the analytics platform is fully integrated with the global
early warning system for better visibility and fast prediction – this
includes

Early warning analysis
Machine learning model
By using Machine Learning (ML) model in Health Matrix PH analytics
platform, healthcare organizations make their decisions based on the
data driven forecast – it is a smart model to guide healthcare
stakeholders to the right decision from PH perspective.
Public Health Analytics

Scalable sophisticated reports for case management, outbreak management and immunization management.

CDC reports including CTAs.

Real-time Data.

Forecast by Data Driven Model.

Wide range of healthcare data sources.

Subject matter experts in PH domain on global and national levels.
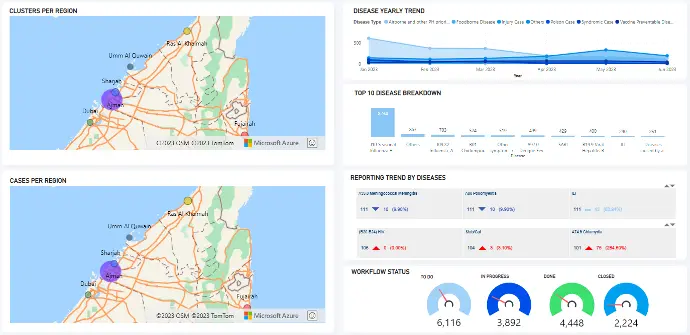
Sample charts
This chart illustrates the clusters & cases per region, where
the user can drill down through the details in an interactive way like
map format, gauge format, trend format and many more.
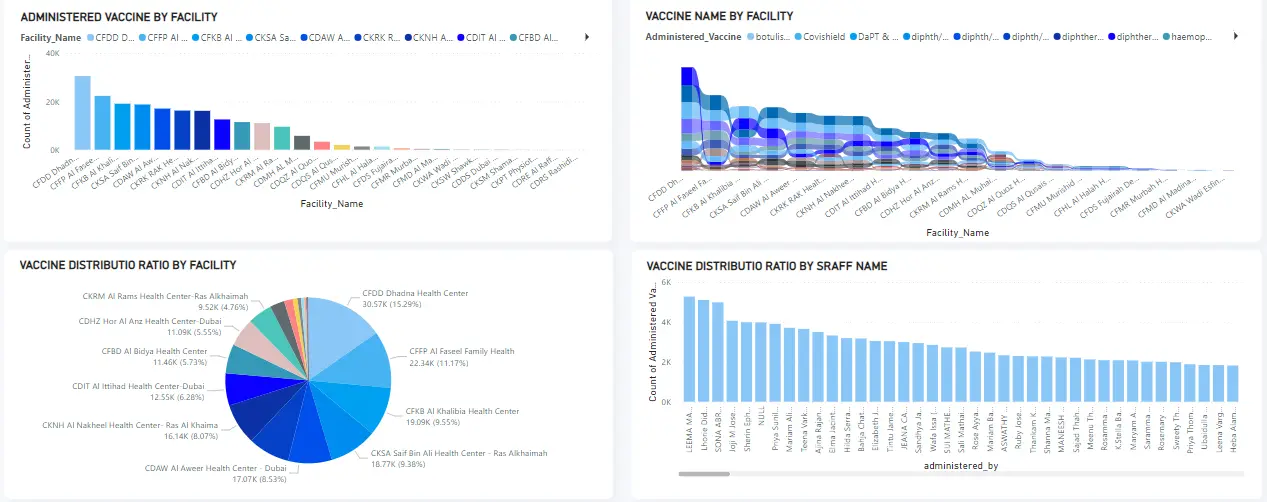
This chart illustrates the immunization data on national level where
user can drill down through the scalable structure of the data starting
from region, healthcare facility, and departmental level. The charts are
not limited to vaccinations, the healthcare stakeholders can see other
domains like inventory levels, medications … etc.