Public Health
Management
AMR Analytics
Monitoring antibiotic-resistant microbes (AMR) and antibiotic-resistant consumption (AMC)
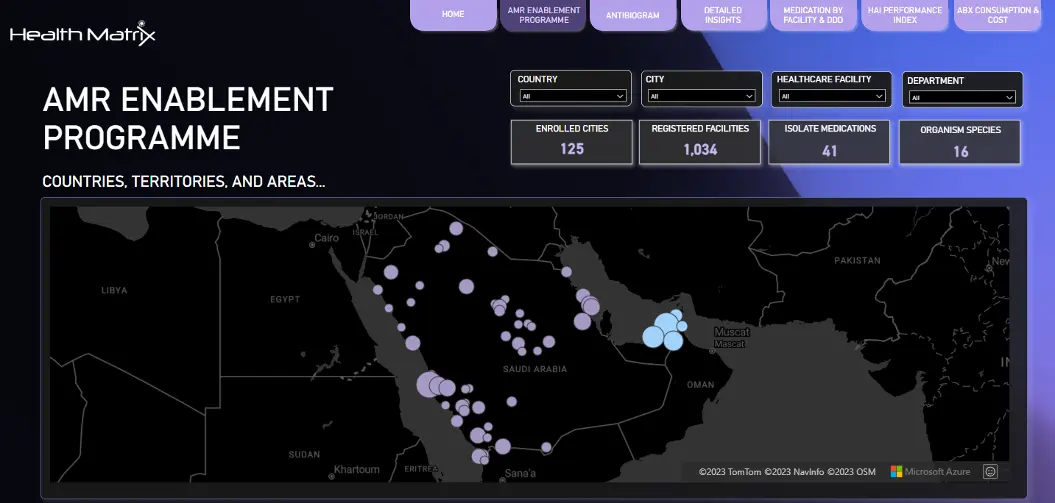
The
Antimicrobial Resistance (AMR) Analytics is an advanced analytics for
monitoring the Antibiotic-Resistant Microbes (AMR) and the Antibiotic-Resistant
Consumption (AMC), which helps in developing one repository for antimicrobial
resistance on national or regional level.

Objectives
The platform helps all healthcare stakeholders in achieving the following objectives:  Strengthen the knowledge and evidence base through surveillance and research Optimize the use of antimicrobial medicines for human health Support patient safety and decrease infections risks Best utilization of all resources available

The platform supports all healthcare organizations to send their data related to the following systems in order to be analyzed for detailed insights and future prediction:
Patient demographics Patient microbiology tests and results
Patient medicationsAfter analyzing the AMR data by the platform engine, the following outcomes and alerts are produced in order to enable the responsible team performing the corrective and preventive actions:
Drug cost alerts
Drug abuse alerts
SIRs alerts
Reports & dashboards Advanced Analytics 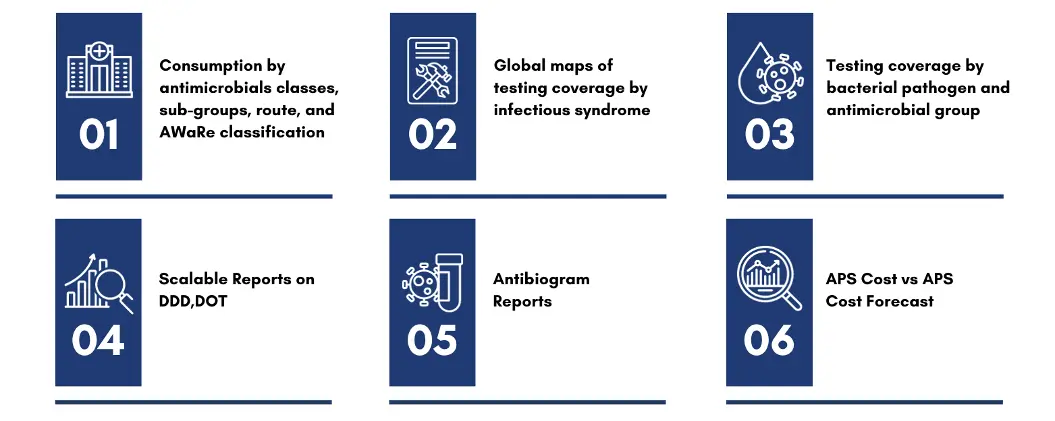
By using Machine Learning (ML) model in Health Matrix AMR analytics
platform, healthcare organizations make their decisions based on the
data driven forecast – it is a smart model to guide healthcare
stakeholders to the right decision from AMR perspective.
Antimicrobial resistance (AMR) analytics

Scalable sophisticated reports for AMR and AMC domains.

CDC and GLASS reports and charts.

Real-time data.

Forecast by data driven model.

Wide range of healthcare data sources.

Subject matter experts in AMR & AMC domains on global and national levels.
Sample Charts
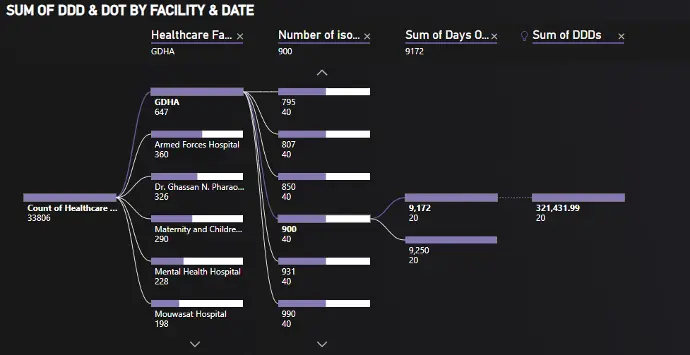
This chart illustrates the sum of defined daily dose (DDD) and the sum
of Days of Therapy (DOT) on healthcare facility level and as per the
dates, where the user can drill down through the steps and interactive
chart in order to produce the results.
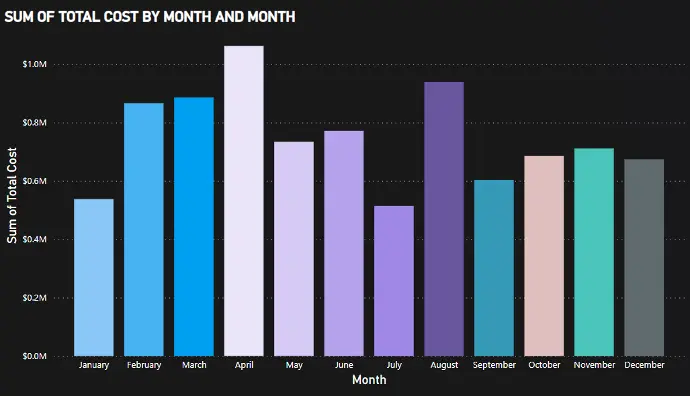
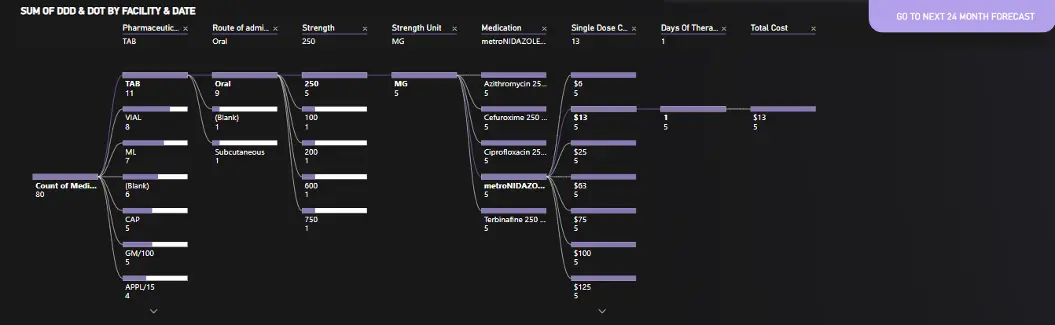
This chart illustrates the cost of antibiotics by month, where the
user can drill down into the details of such cost and against which
antibiotics. That will give more clarity and will drive the financial
informed decisions by healthcare stakeholders.